

Introduction
Mean and standard deviation are fundamental statistical concepts used in data science to summarize and analyze data distributions. Whether you’re working with machine learning models or exploring datasets, understanding these metrics is crucial for making informed decisions.
This tutorial will explain the mean and standard deviation, their significance, and how to calculate them using Python.
What is Mean in Statistics?
The mean (or average) is the sum of all values in a dataset divided by the total number of values. It provides a central value representing the dataset.
Mean Formula:
The mathematical formula for the mean is:
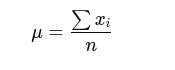
where:
- xi represents each value in the dataset.
- n is the total number of values.
Example Calculation:
Given the dataset:
[10, 20, 30, 40, 50]Python Code:
import numpy as np

data = [10, 20, 30, 40, 50]
mean_value = np.mean(data)
print("Mean:", mean_value)  # Output: 30.0
What is Standard Deviation in Statistics?
The standard deviation measures how spread out the values are in a dataset. A low standard deviation means values are close to the mean, while a high standard deviation indicates more variability.
Standard Deviation Formula:
The mathematical formula for standard deviation is:
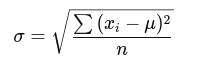
where:
- xi is each data point
 is the mean
- n is the total number of values
Example Calculation:
Given the dataset:
[10, 20, 30, 40, 50]Python Code:
std_dev = np.std(data)
print("Standard Deviation:", std_dev)  # Output: 14.14
Importance of Mean and Standard Deviation in Data Science
- Data Analysis – Helps in understanding data distribution and central tendency.
- Outlier Detection – Identifies unusual values that deviate significantly from the mean.
- Machine Learning – Used in feature scaling and normalization techniques.
- Risk Assessment – Measures the volatility of financial and business data.
Real-World Use Cases in Data Science
- Healthcare: Analyzing patient health data and variations in medical test results.
- Finance: Measuring stock price volatility and investment risks.
- Marketing: Understanding customer purchase behaviors and campaign performance.
Conclusion
Mean and standard deviation are essential tools in data science, providing key insights into data distributions. By mastering these concepts, you can enhance your statistical analysis skills and make data-driven decisions.